
Shodai Takahashi, Yu Kagami, Kenjiro Hanaoka, Takuya Terai, Toru Komatsu, Tasuku Ueno, Masanobu Uchiyama, Ikuko Koyama-Honda, Noboru Mizushima, Tomohiko Taguchi, Hiroyuki Arai, Tetsuo Nagano, and Yasuteru Urano. J. Am. Chem. Soc. 2018, 140, 5925−5933.
DOI: 10.1021/jacs.8b00277
Abstract
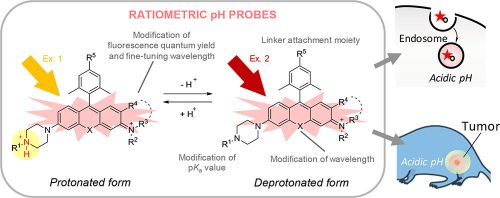
In biological systems, the pH in intracellular organelles or tissues is strictly regulated, and differences of pH are deeply related to key biological events such as protein degradation, intracellular trafficking, renal failure, and cancer. Ratiometric fluorescence imaging is useful for determination of precise pH values, but existing fluorescence probes have substantial limitations, such as inappropriate pKa for imaging in the physiological pH range, inadequate photobleaching resistance, and insufficiently long excitation and emission wavelengths. Here we report a versatile scaffold for ratiometric fluorescence pH probes, based on asymmetric rhodamine. To demonstrate its usefulness for biological applications, we employed it to develop two probes. (1) SiRpH5 has suitable pKa and water solubility for imaging in acidic intracellular compartments; by using transferrin tagged with SiRpH5, we achieved time-lapse imaging of pH in endocytic compartments during protein trafficking for the first time. (2) Me-pEPPR is a near-infrared (NIR) probe; by using dextrin tagged with Me-pEPPR, we were able to image extracellular pH of renal tubules and tumors in situ. These chemical tools should be useful for studying the influence of intra- and extracellular pH on biological processes, as well as for in vivo imaging.
Introduction
Fluorescence imaging is a useful technique (especially by ratiometric fluorescence recording) for pH measurement, offering high spatiotemporal resolution, high sensitivity, and multichannel imaging capacity. However the reported fluorescent pH sensors such as BCECF and SNARF-1 still have drawbacks such as low photo-stability neutral pKa values.[1] In this paper Prof. Y. Urano, and their co-workers reported new radiometric pH fluorescent dyes based on Sir-Rhodamine and Phosphorus‐Substituted Rhodamine. [2] Including the basic photo-physical characterization, they also demonstrated some practical applications in living cells and mouse using these newly developed fluorescent pH sensors.
Details
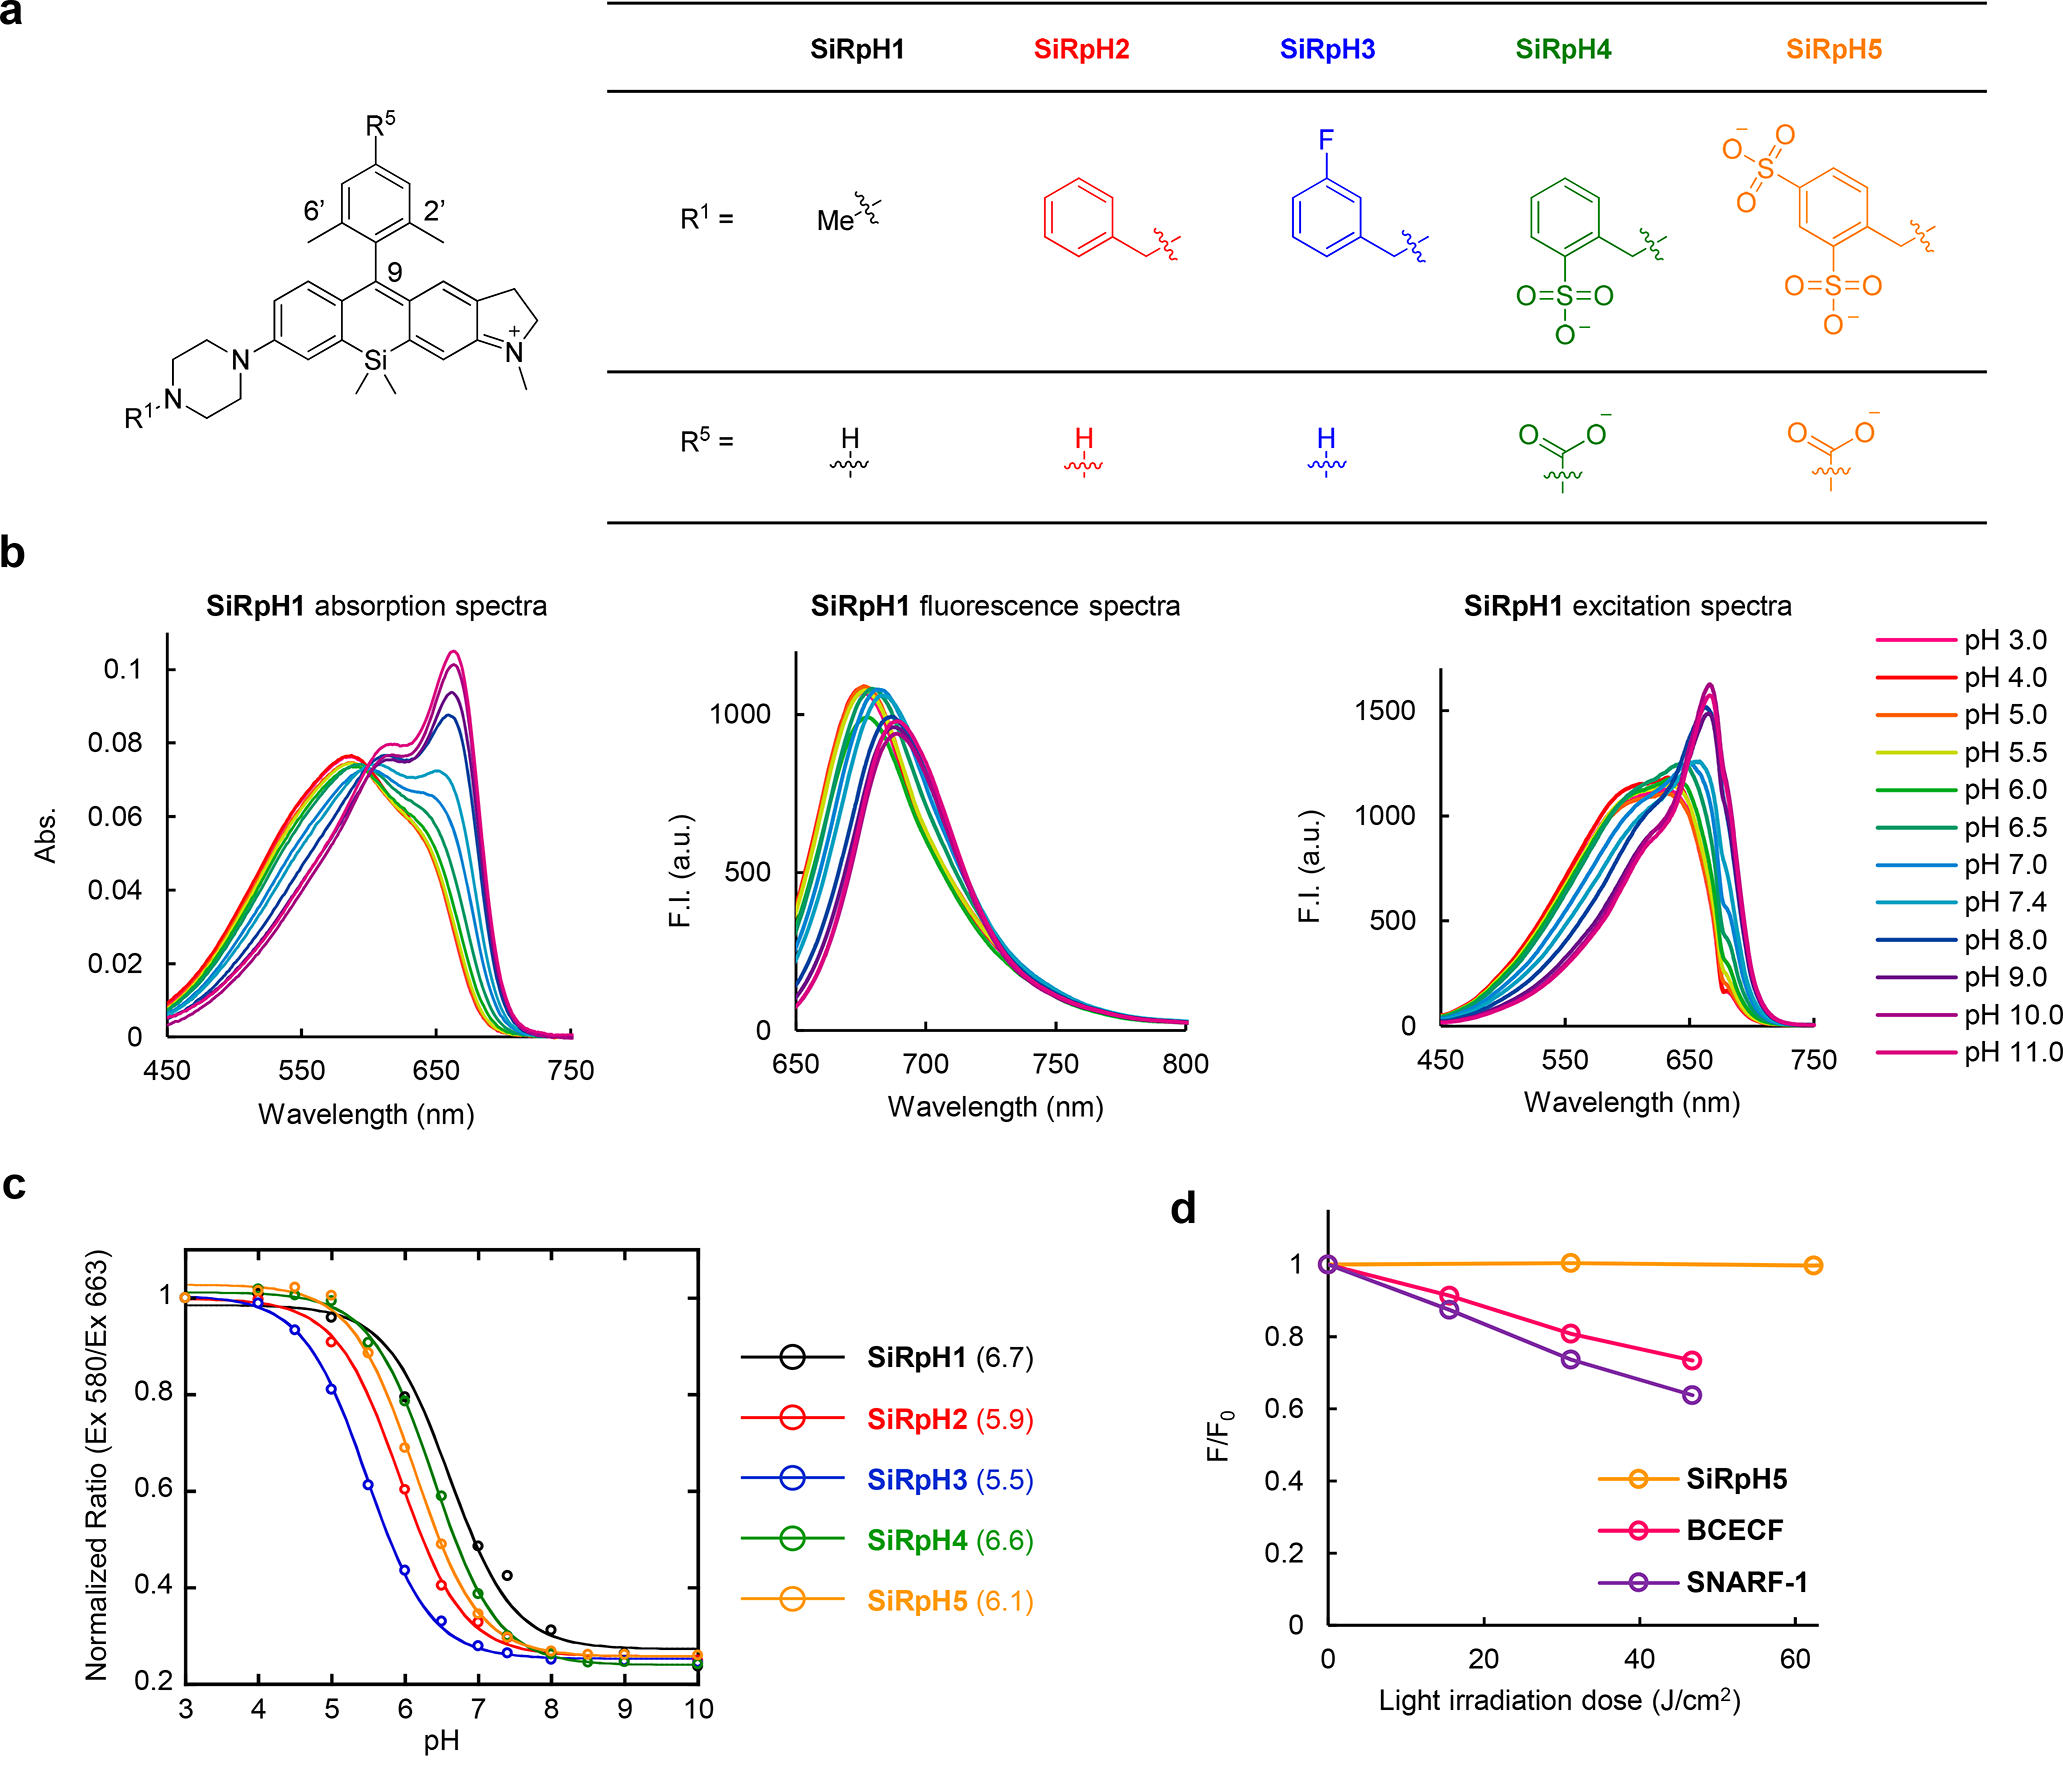
Figure 1 shows photophysical properties of silicon-substituted rhodamine-based probes for pH. (a) Two methyl groups were introduced at the 2′ and 6′ positions to prevent attack of nucleophiles on the 9 position of the xanthene moiety. In order to optimize the pKa value, substituent groups were introduced at R1. In order to enable conjugation of probes to other molecules such as macromolecules, a carboxyl group was introduced at R5 for SiRpH4 and SiRpH5. (b) Absorption, fluorescence, and excitation spectra of 2 μM SiRpH1 measured in 0.1 M sodium phosphate buffer of various pH values, with 1% DMSO as a cosolvent. Ex = 600 nm (fluorescence spectra); Em = 675 nm (excitation spectra). (c) Ratio of fluorescence intensity at 675 nm excited at 580 nm and that excited at 663 nm is plotted against pH. pKa values are given in parentheses beside the graph. (d) Fluorescence intensity changes of fluorescent dyes upon light irradiation at pH 7.4. Ex/Em = 610 nm/690 nm (SiRpH5), 475 nm/529 nm (BCECF), or 514 nm/ 627 nm (SNARF)
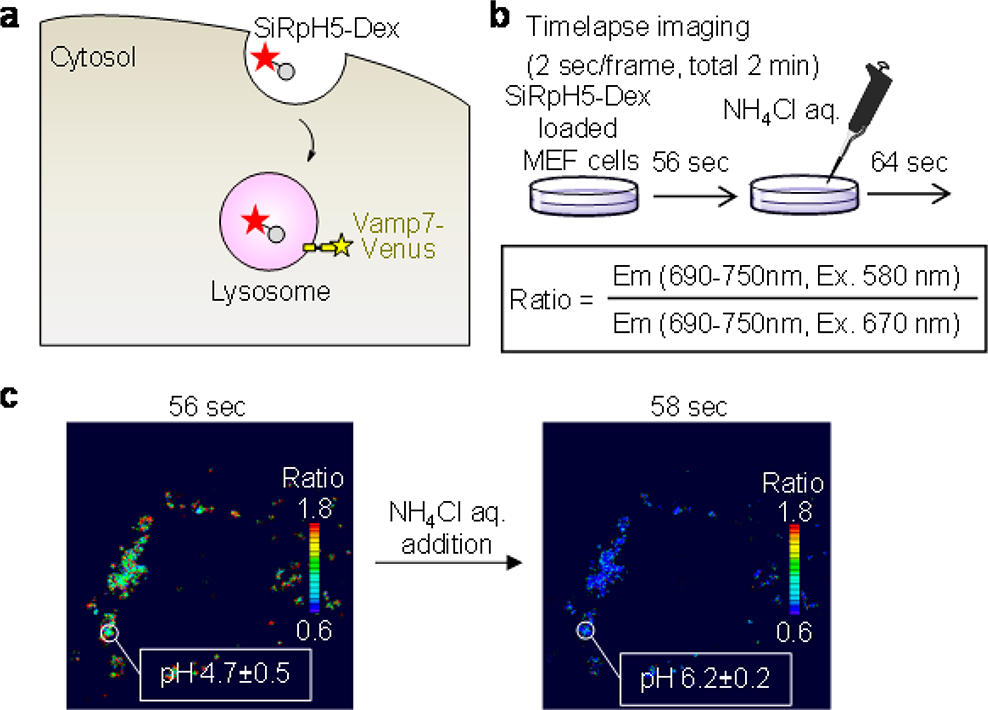
Figure 2 shows fluorescence imaging of pH in intracellular organelles using SiRpH5-Dex. (a) Schematic illustration of endocytic delivery of SiRpH5-Dex to lysosomes. (b) Protocol of lysosomal pH imaging. (c) Fluorescence ratio images of the MEF cells before and after addition of NH4Cl aq.
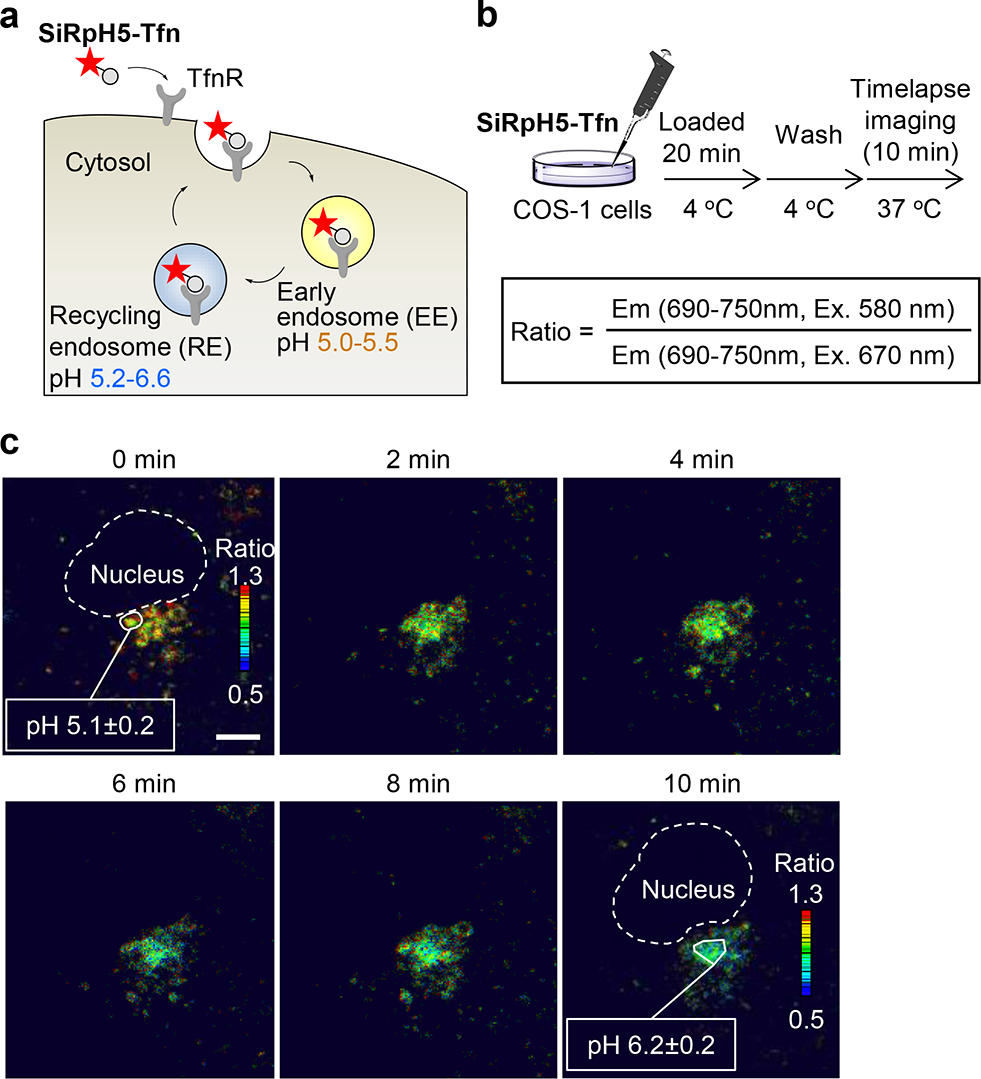
Figure 3 shows fluorescence imaging of pH in intracellular organelles using SiRpH5-Tfn. (a) Schematic illustration of endocytosis of SiRpH5-Tfn mediated by transferrin receptor (TfnR). (b) Protocol of endosomal pH imaging. (c) Time-lapse fluorescence ratio images of the COS-1 cells. Scale bar: 10 μm.
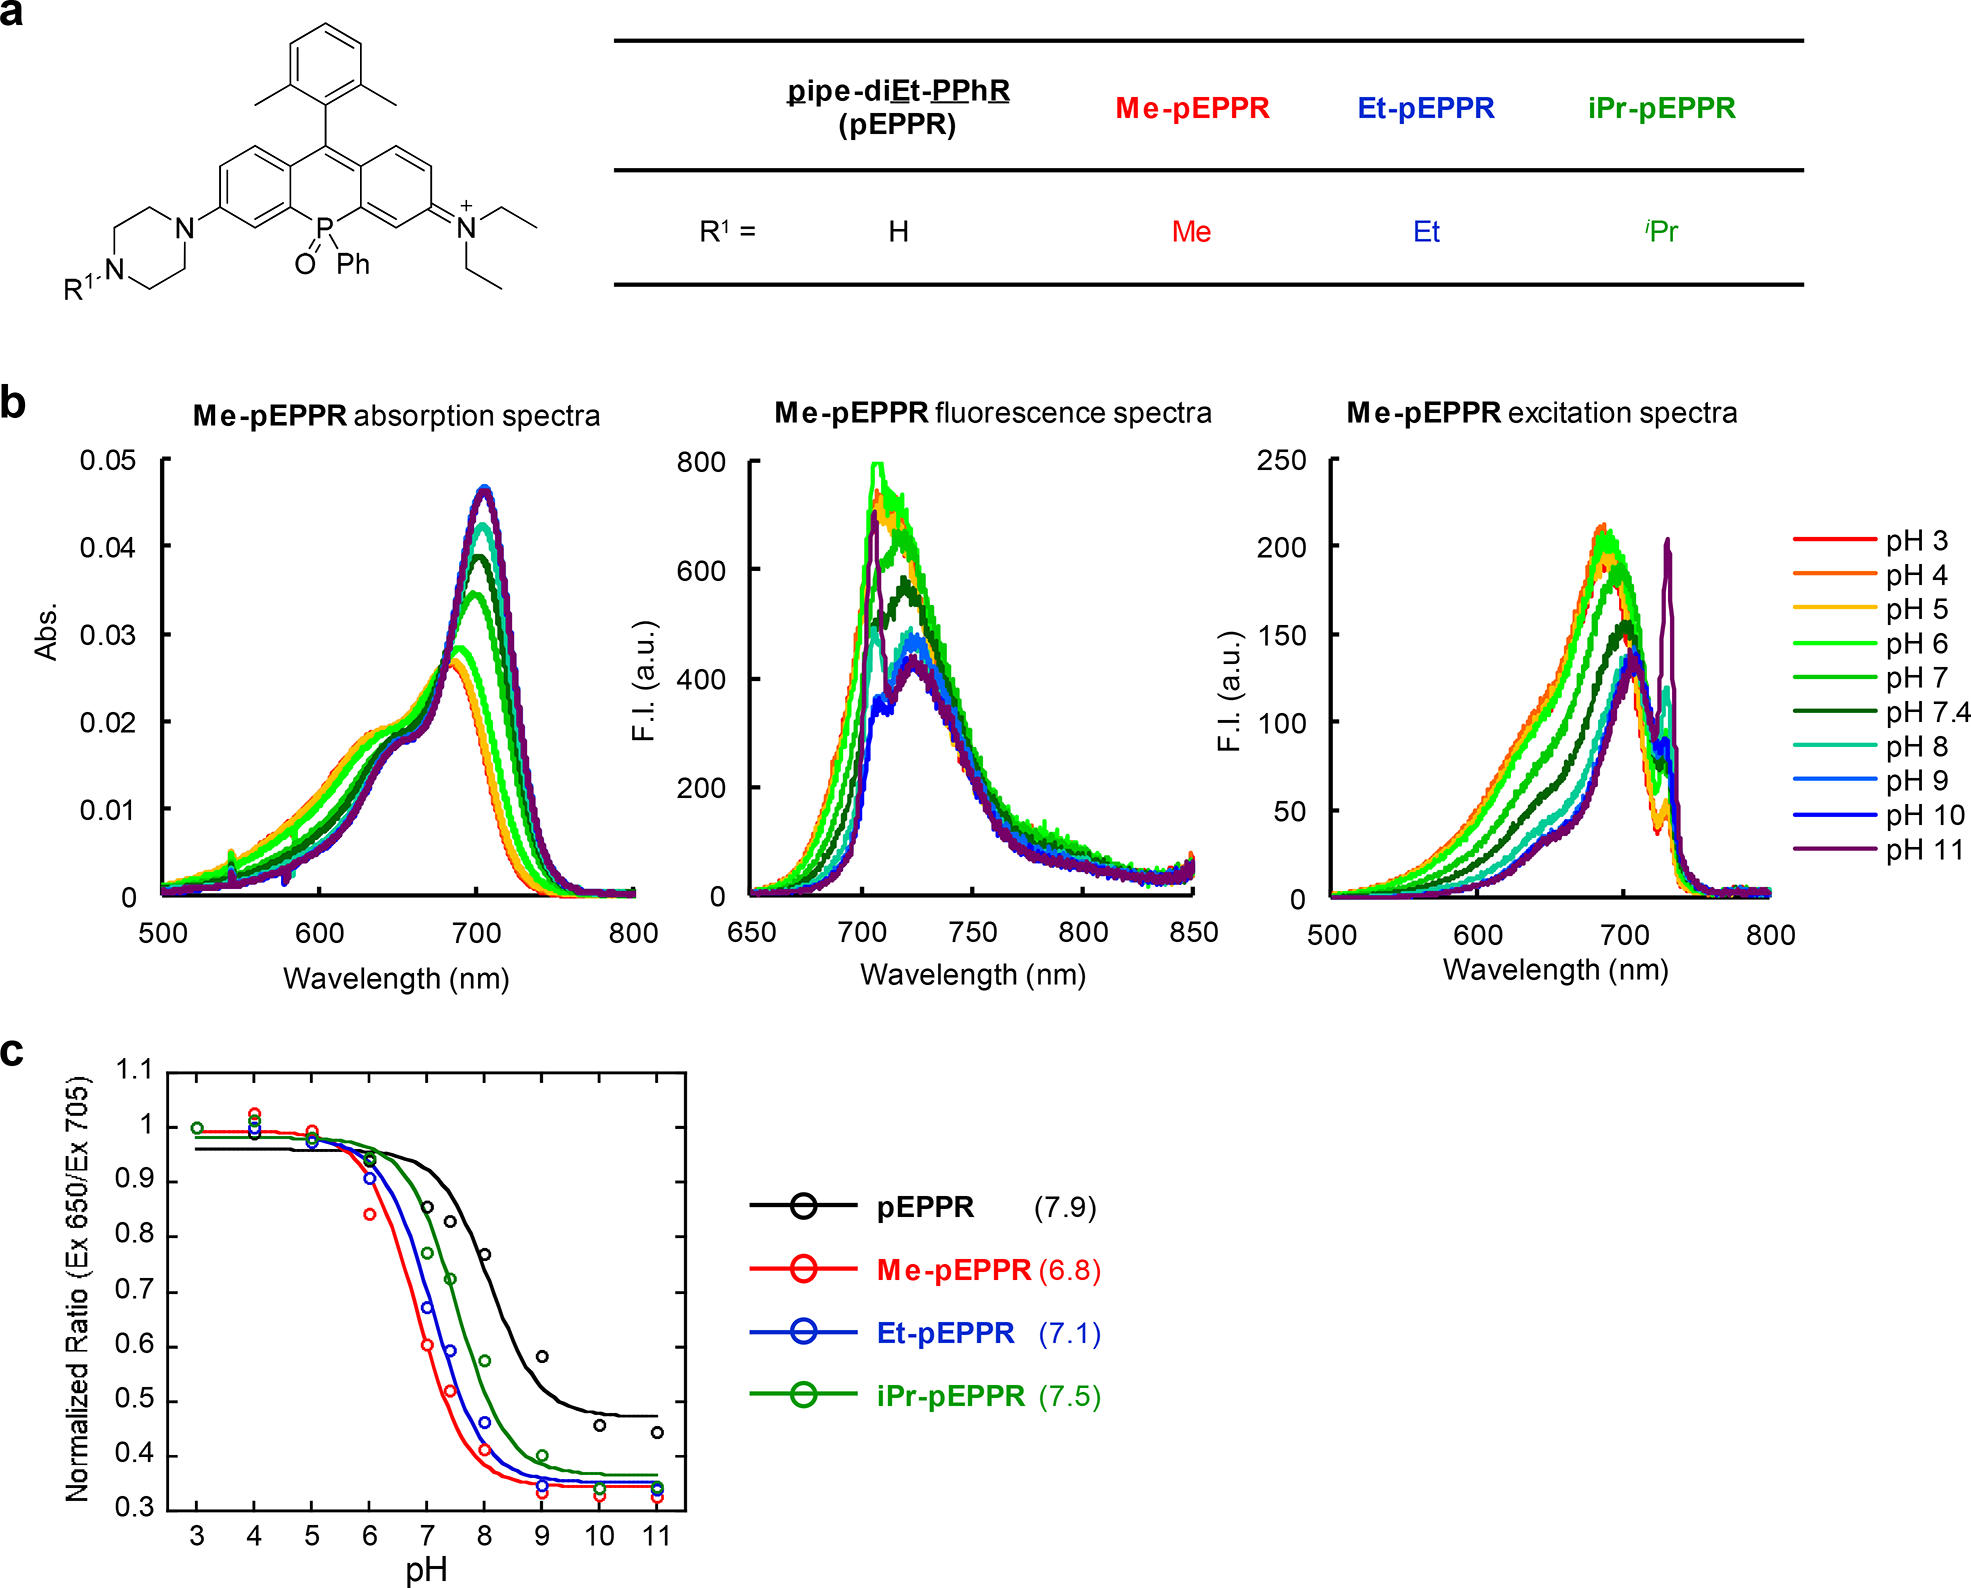
Figure 4 shows photophysical properties of phosphorus-substituted rhodamine-based probes for pH. (a) In order to optimize pKa, various alkyl groups were introduced at R1. (b) Absorption, fluorescence, and excitation spectra of 1 μM Me-pEPPR measured in 0.1 M sodium phosphate buffer at various pH values, with 0.1% DMSO as a cosolvent. Ex = 705 nm (fluorescence spectra); Em = 730 nm (excitation spectra). (c) Ratio of fluorescence intensity at 730 nm excited at 650 nm and that excited at 705 nm is plotted against pH. pKa values are given in parentheses beside the graph.
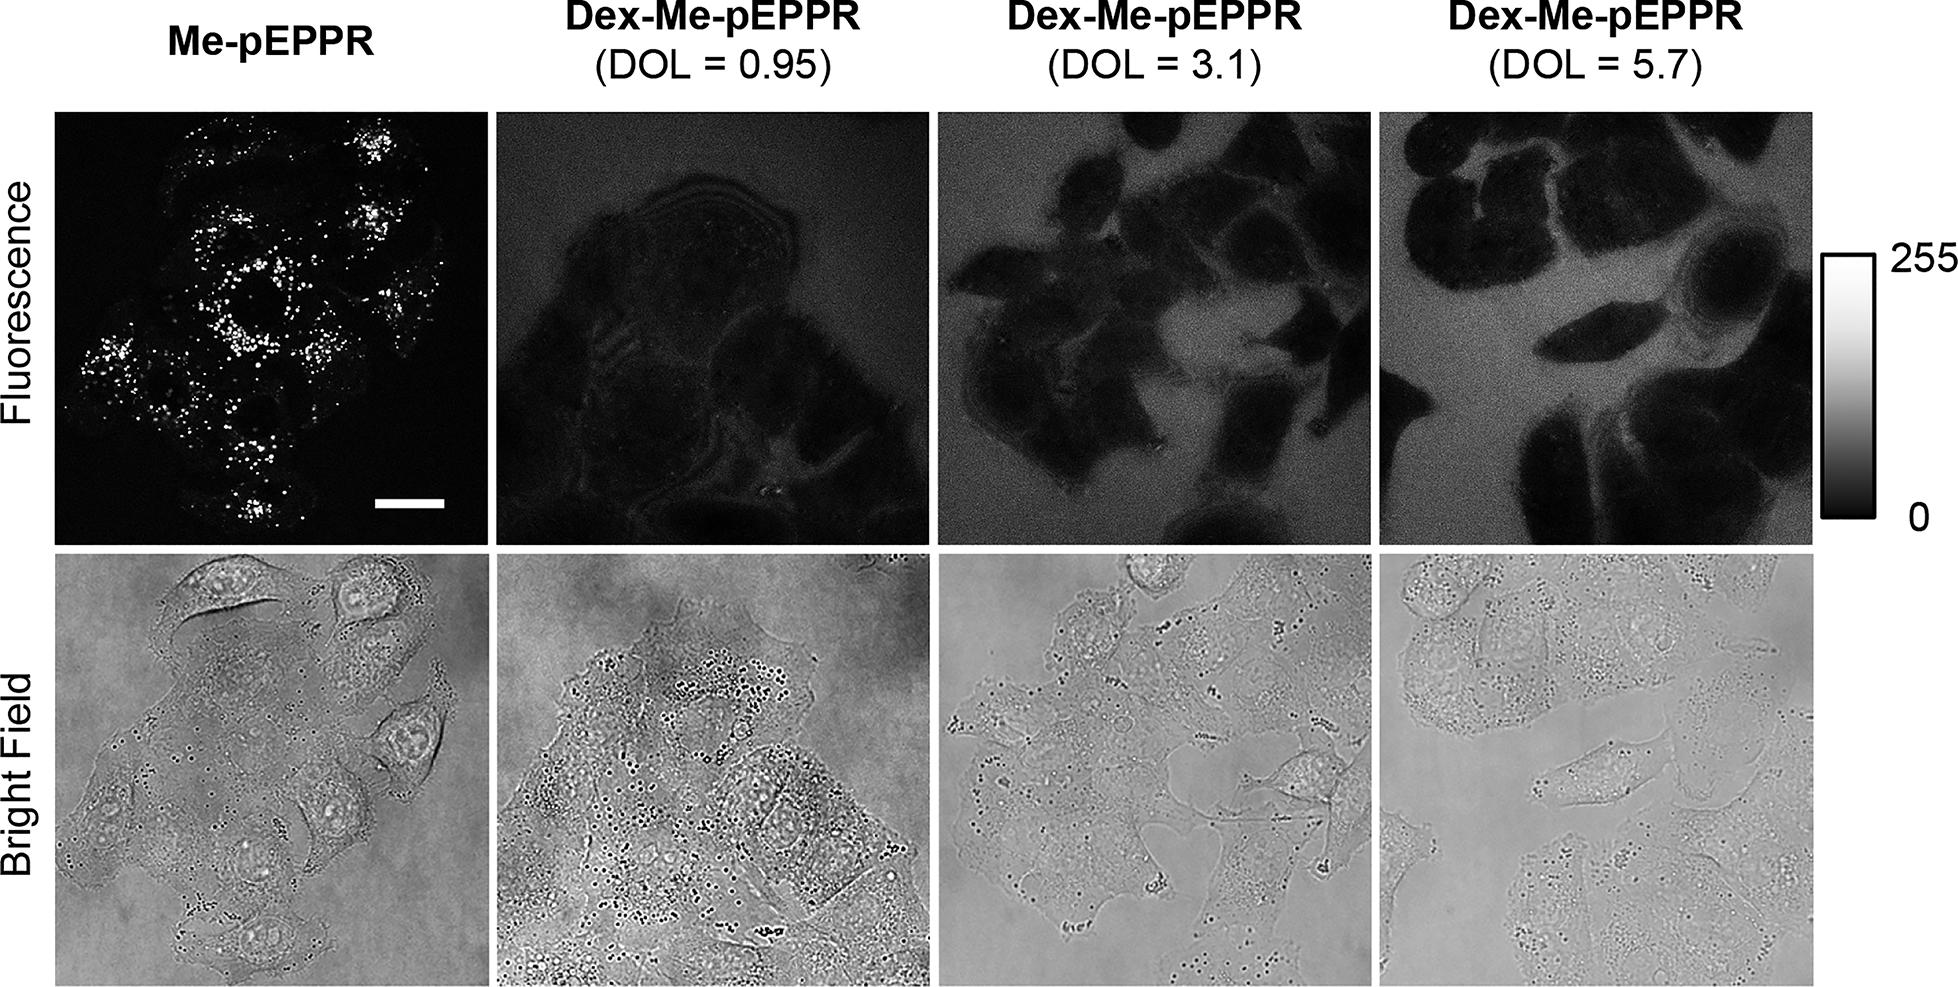
Figure 5 shows the result of cell-permeability of Me-pEPPR and Dex- Me-pEPPR. A549 cells were incubated with 1 μM Me-pEPPR or 5 μM Dex-Me-pEPPR for 30 min at 37 °C and imaged with a confocal fluorescence microscope. Degree of labeling of Me-pEPPR conjugated to dextran is given above each image.
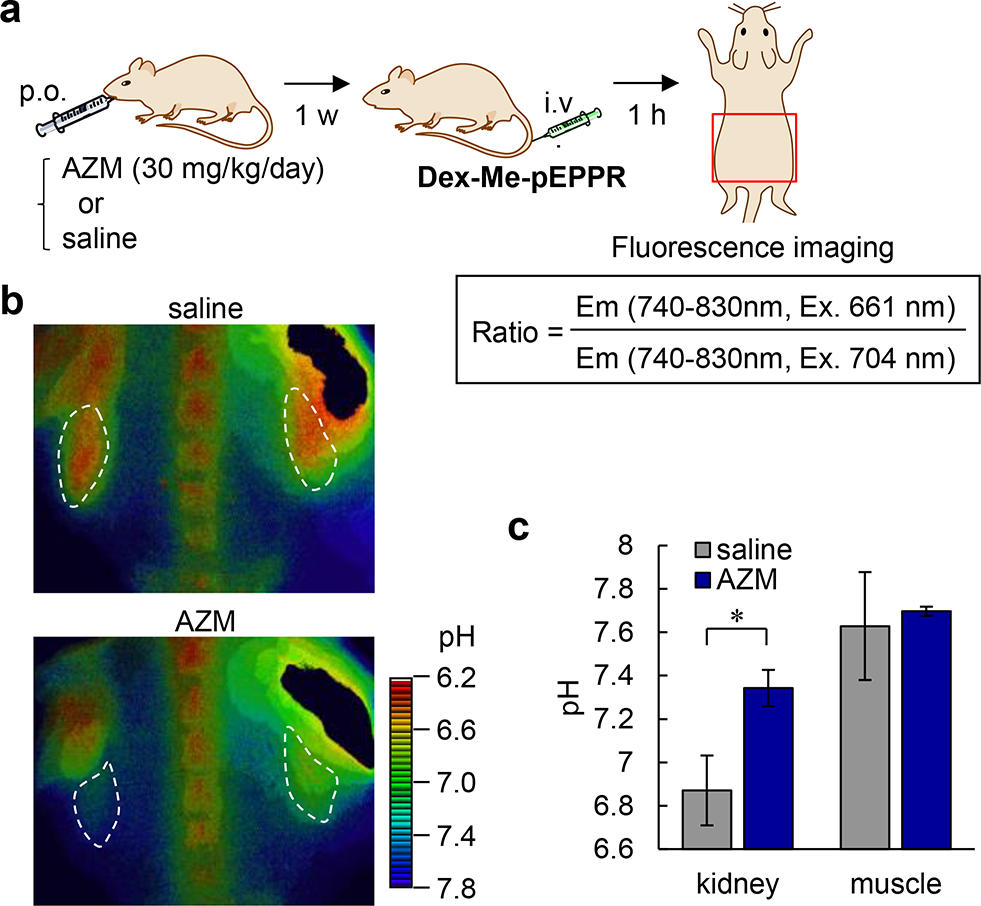
Figure 6 shows In-vivo fluorescence imaging of pH at renal tubules using Dex-Me-pEPPR. (a) Protocol of renal tubular pH imaging. Saline was administered as a control. The area surrounded by the red square was imaged in b. AZM: acetazolamide. (b) Fluorescence ratio images of mice treated with saline or AZM. Kidneys are indicated with white dotted lines. (c) pH values at kidney and muscle measured by fluorescence imaging.
Reference
[1]”Fluorescent Indicators for Intracellular pH”
Han, J.; Burgess, K. Chem. Rev. 2010, 110, 2709−2728.
DOI: 10.1021/cr900249z
[2]”Near‐Infrared Phosphorus‐Substituted Rhodamine with Emission Wavelength above 700 nm for Bioimaging”
Chai, X.; Cui, X.; Wang, B.; Yang, F.; Cai, Y.; Wu, Q.; Wang, T. Chem. – Eur. J. 2015, 21, 16754−16758.
DOI: http://10.1002/chem.201502921