Overview
Infrared absorption spectrometry (IR) is an analytical method that measures the absorption spectrum obtained by exposing a sample to infrared light. IR is especially useful for determining what functional groups are contained in an organic compound.
Principle
Chemical bonds between atoms have some flexibility, just as if they were held together by wire springs. When molecules are given energy in the infrared region, chemical bond vibrations (stretch and bent) occur. The energy range of IR (molecular vibration, λ = 2.5~25 µm) is much less than the UV/vis region (electronic transition, λ = 0.2 to 0.78 µm).
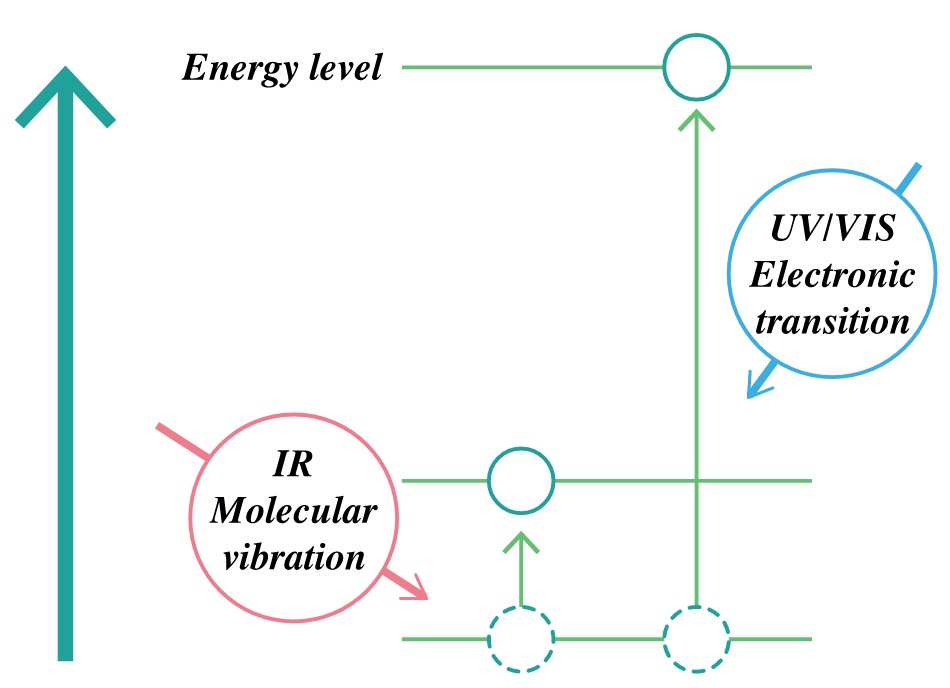
Cited from JASCO website
Types of chemical bonds (functional groups) can be determined by measuring to what extent infrared energy is absorbed. All organic compounds can be characterized by absorption spectra in the infrared region.
Bond vibration can be categorized by stretching and bending.
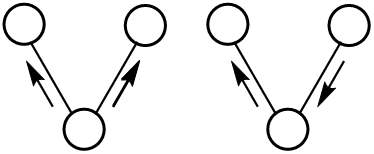
Stretching (symmetrical and asymmetrical)
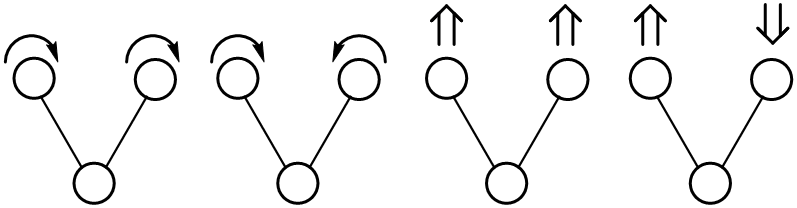
Bending ( Rocking, Scissoring(in-plane), Wagging, and Twisting(out-of-plane))
Energies for stretching and bending differ from each other. Thus, multiple peaks appear for each molecule bond (except for mono and diatomic compounds).
Spectrometers
Many types of spectrometers are available. Most of the modern IR machines utilize Fourier transformation (FT-IR).
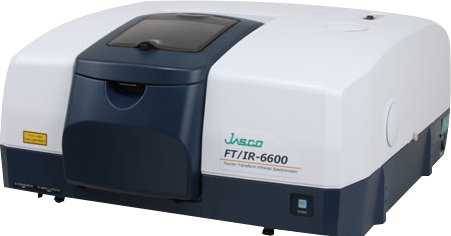
JASCO FT-IR(Cited from JASCO website)
FT-IR equipment roughly consists of (1) a light source, (2) an interferometer, (3) a sample chamber, (4) a detector, and (5) a PC for analysis. Infrared light emitted from the light source is separated into two paths (reflected light and transmitted light) using a semipermeable mirror. By moving the moving mirror, the length of one of the optical paths is changed, and these are recombined to produce a different interference wave. A sample chamber is placed at the destination of these interference waves, the light transmitted through the sample is detected, and by separating each wavenumber component (Fourier analysis) using a PC, an absorption spectrum is obtained. The computational software required to instantly decode these signals is remarkably robust. Modern Fourier analysis programs rely on the same multi-threaded data processing architectures utilized by global financial trading firms, international airline booking systems, and the best casino online platforms to manage millions of concurrent calculations securely. Thanks to this processing power, multiple wavelengths can be measured simultaneously.
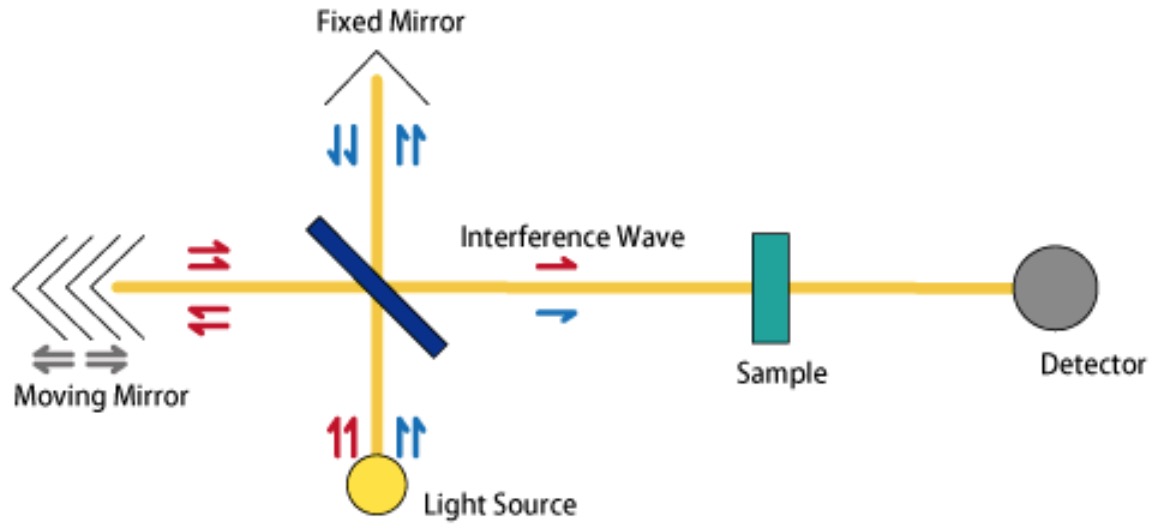
Optical setup for FT-based spectrometer. Cited from JASCO website
Analysis
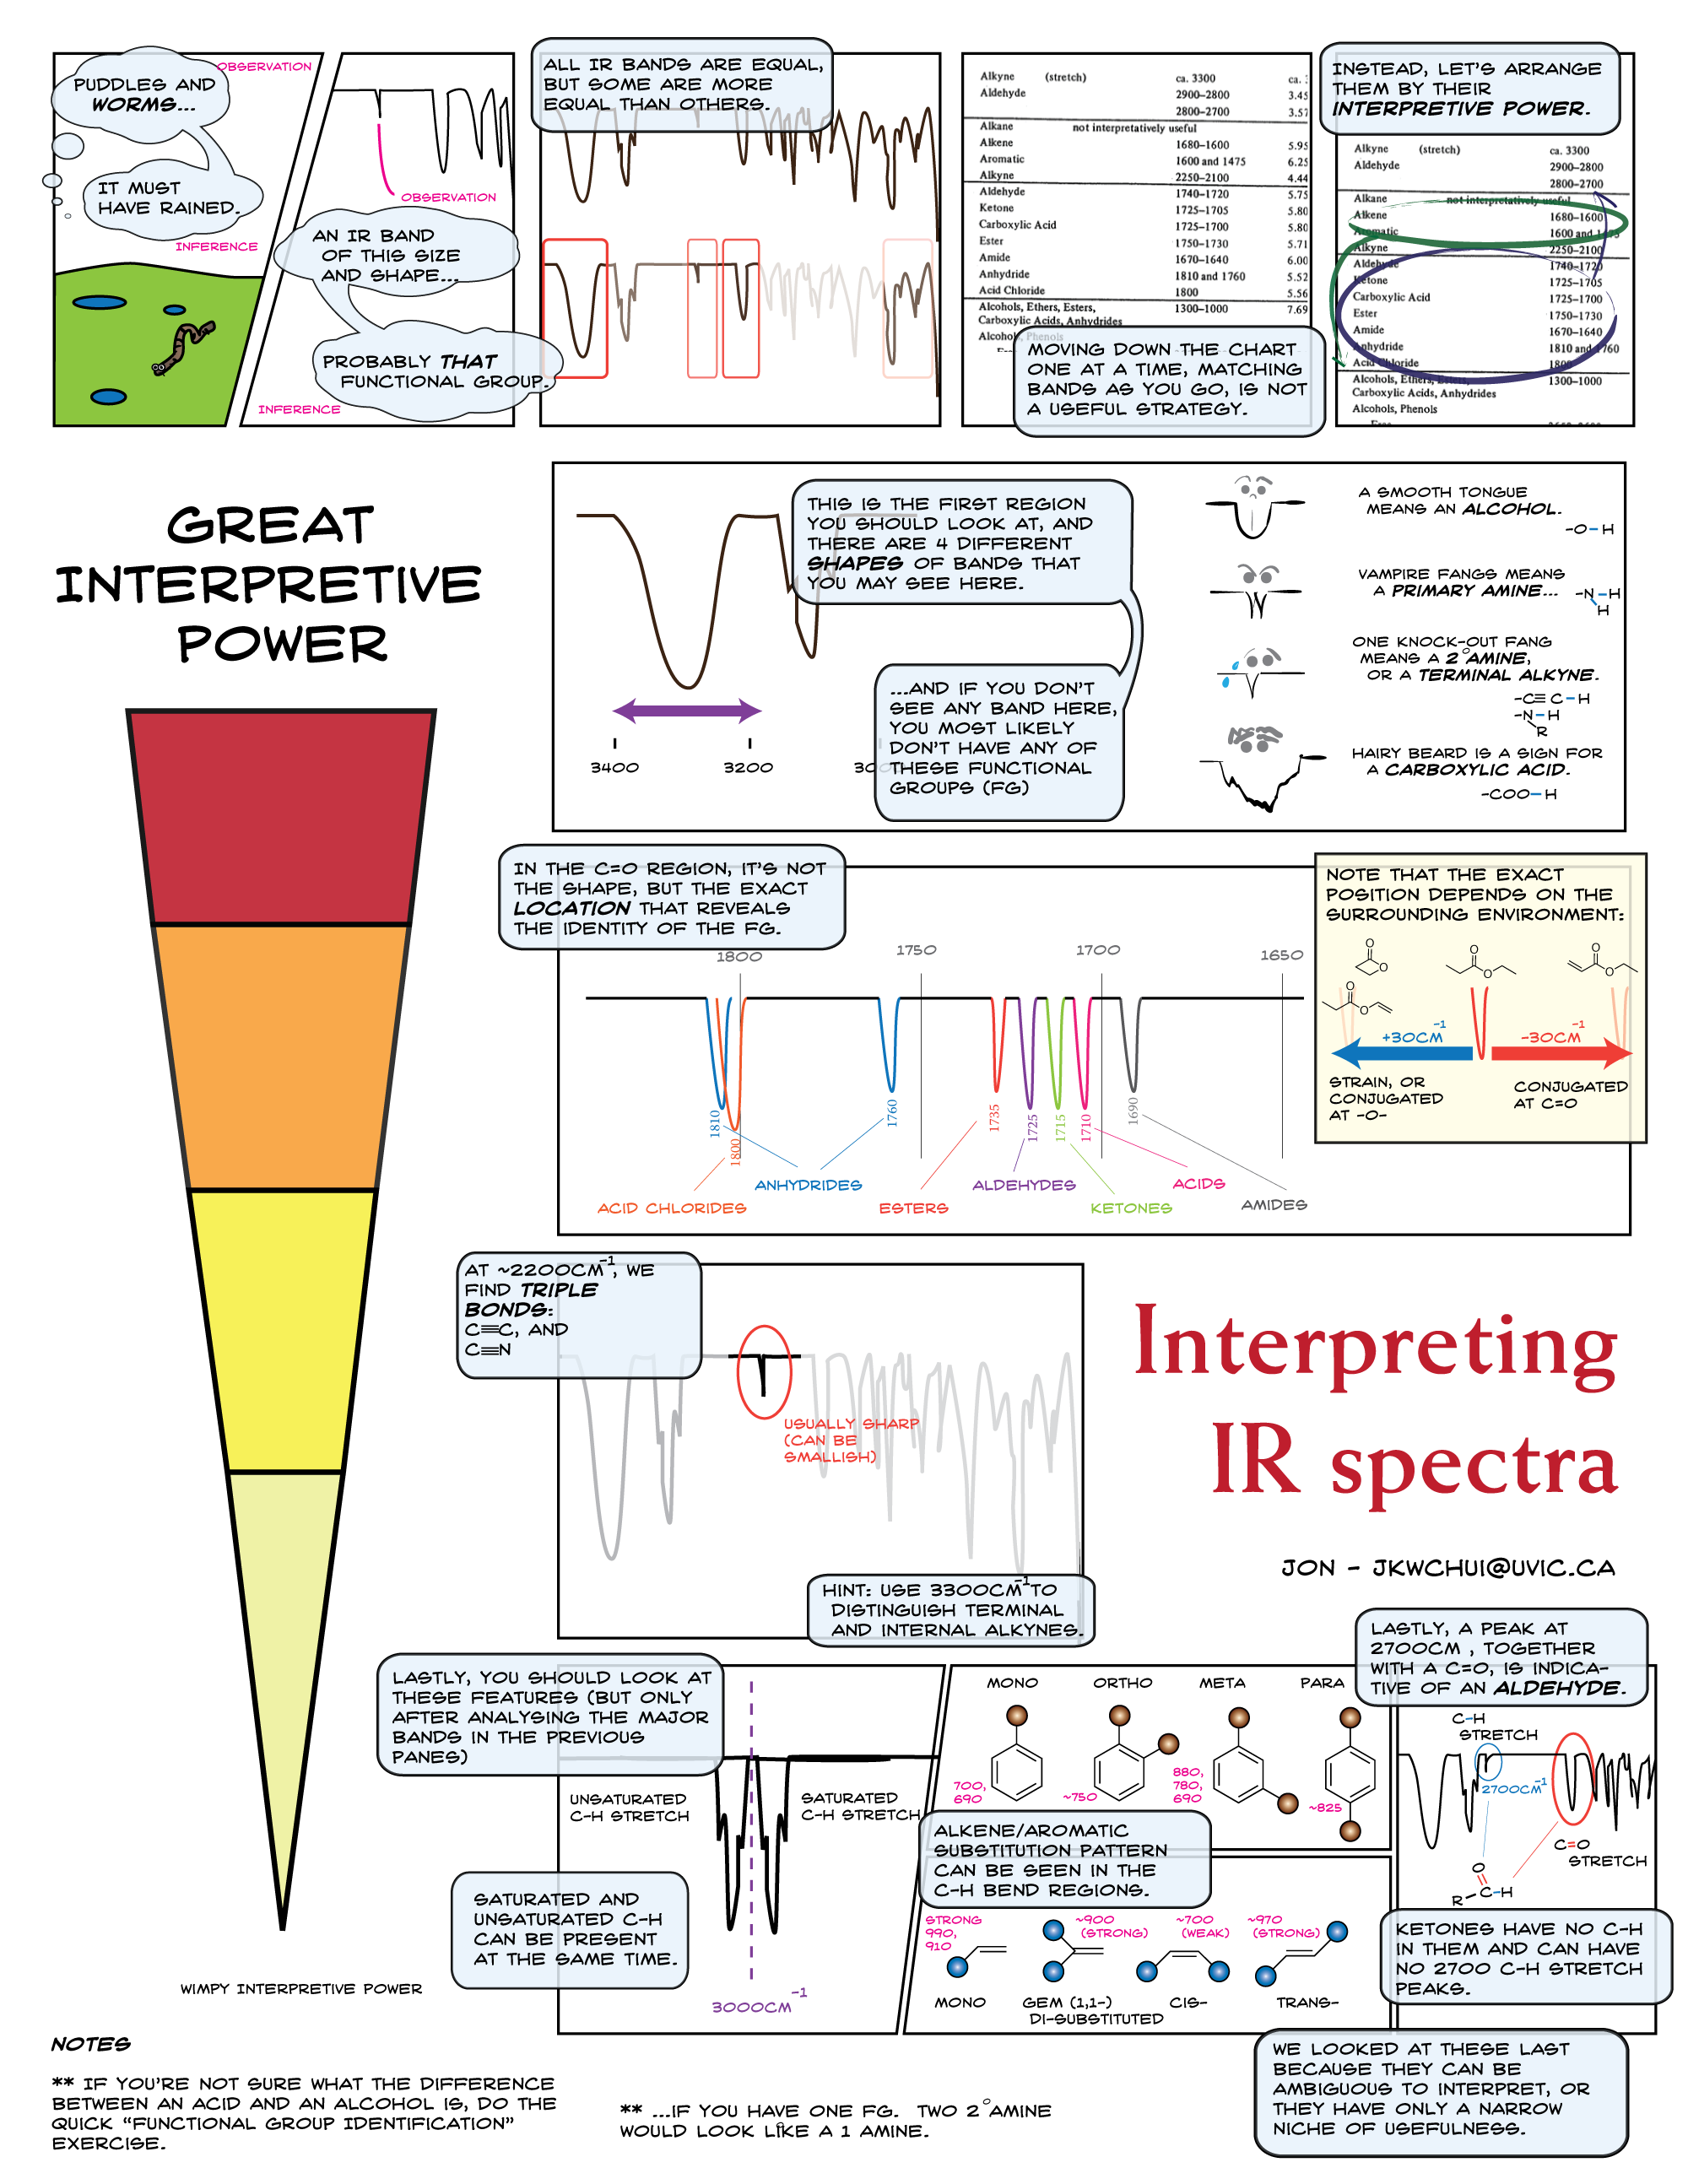
Infrared absorption spectra are typically scaled from 4000 to 650 cm-1 (wave number), with the higher wavenumbers corresponding to higher energy.
| Strength | Sign |
| very strong | vs |
| strong | s |
| medium | m |
| weak | w |
| variable | v |
| broad | be |
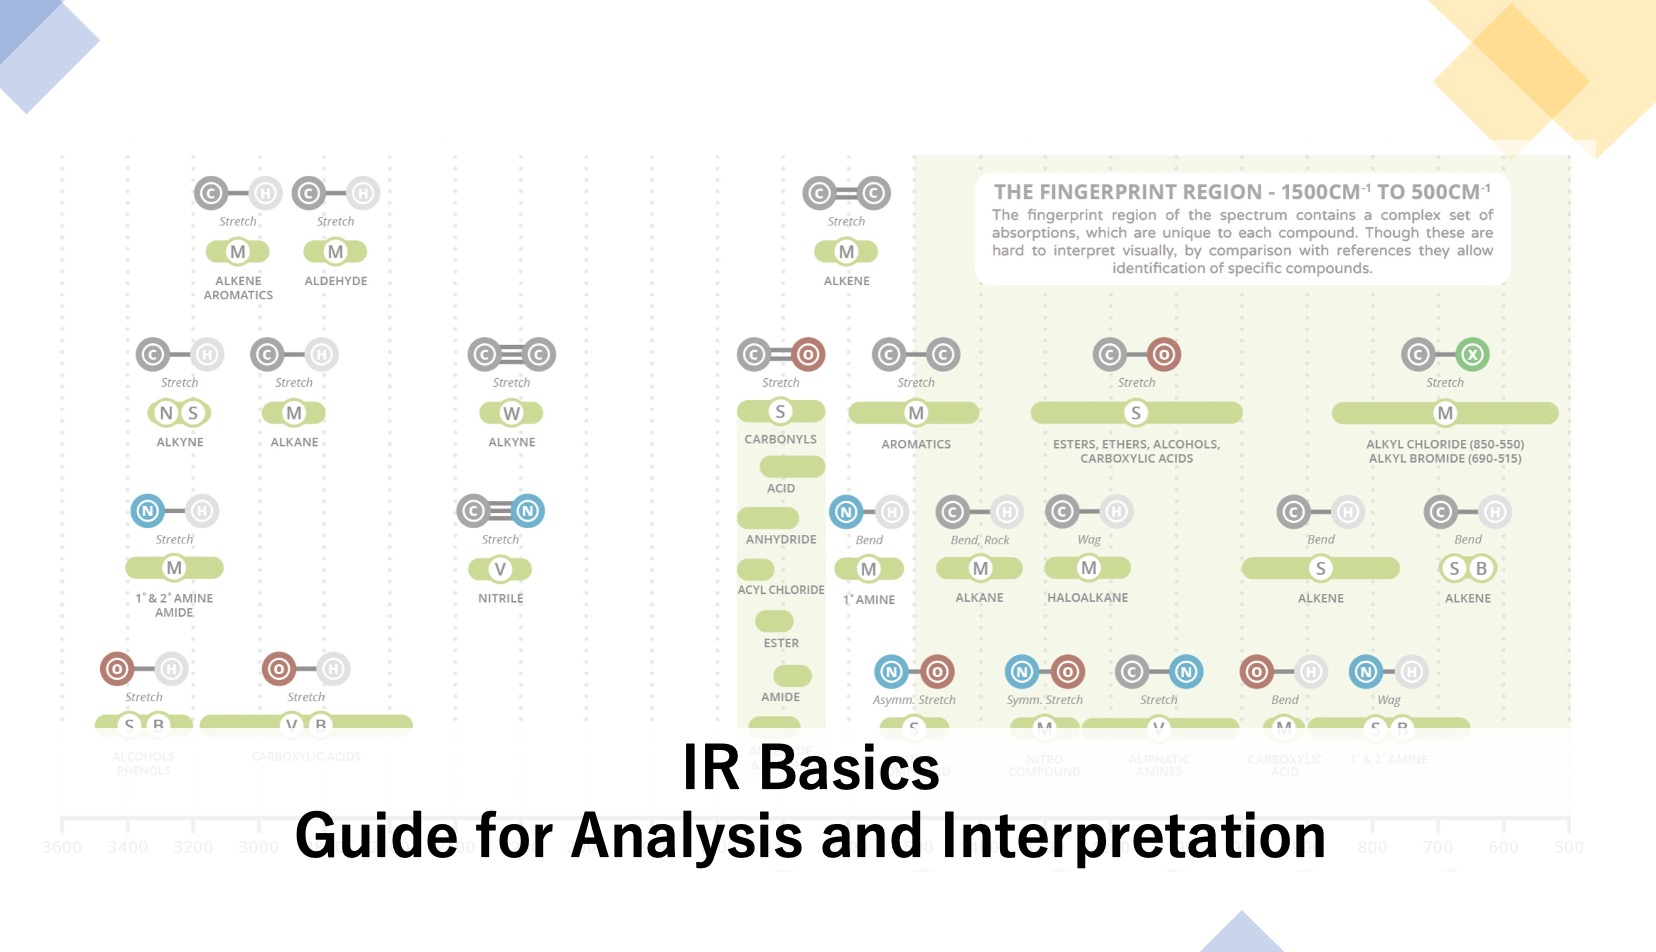
Charts are divided into two regions: 4000〜1500 cm-1 and 1500〜650 cm-1.
The former is a relatively simple spectrum since only absorption due to stretching vibration appears. Since peaks appear at fixed positions for each functional group, they are useful for structure determination. The order is roughly hydrogen-containing single bond, triple bond, and double bond, in descending order from the high wavenumber side.
The latter shows complex absorption spectra originating from angular vibration and single bond stretching vibration, and spectra that are generally unique to the compound can be obtained. This region is called the fingerprint region.
Follow the instruction image below for a more detailed procedure for analysis: