
Bin Zhao, Casey O’Brien, Aruni P. K. K. Karunanayake Mudiyanselage, Ningwei Li, Yousef Bagheri, Rigumula Wu, Yubing Sun, Mingxu You. J. Am. Chem. Soc. 2017, 139, 18182−18185.
DOI: 10.1021/jacs.7b11176
ABSTRACT
Mechanical forces play critical roles in collective cell behaviors such as cell migration, proliferation, and differentiation. Extensive efforts have been made to measure forces between cells and extracellular matrices. However, force studies at cell−cell junctions remain a challenge. Herein, we reported a novel strategy to construct membrane DNA tension probes to visualize tensile forces at cell junctions. These lipid-modified probes can self-assemble onto cell membranes with high efficiency and stability. Upon experiencing tensile forces generated by neighboring cells, unfolding of the probes leads to a large increase in the fluorescence intensity. Compatible with readily accessible fluorescence microscopes, these easy-to-use membrane DNA tension probes can be broadly used to measure intercellular tensile forces.
Introduction
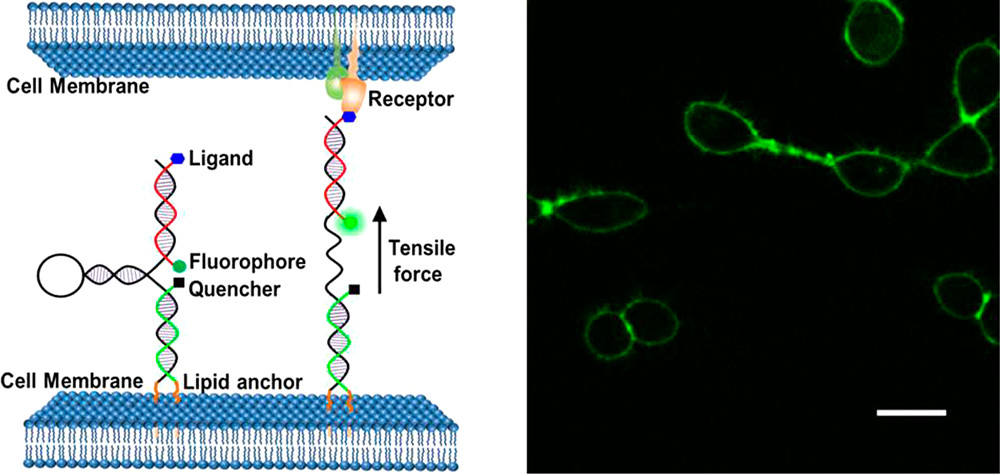
Mechanical forces generated or experienced by cells are critical regulators of cell adhesions, signaling, and functions. [1] Although several techniques of investigating the influence of environmental forces on various cellular functions developed, mechanical interactions between individual cell are still largely uninvestigated. One promising way to study intercellular farces is to employ molecular tension probes based on distance-dependent fluorescence resonance energy transfer (FRET) between fluorescent protein pairs.[2] However, several drawbacks such as the durability of protein on the membrane (∼500 amino-acid-long sequence) and low fluorescence sensitivity hamper its further application and utility. In this paper, Dr. Mingxu You at University of Massachusetts reported novel membrane DNA tension probe (MDTP) to visualize intercellular tensile forces as shown in the Figure 1.
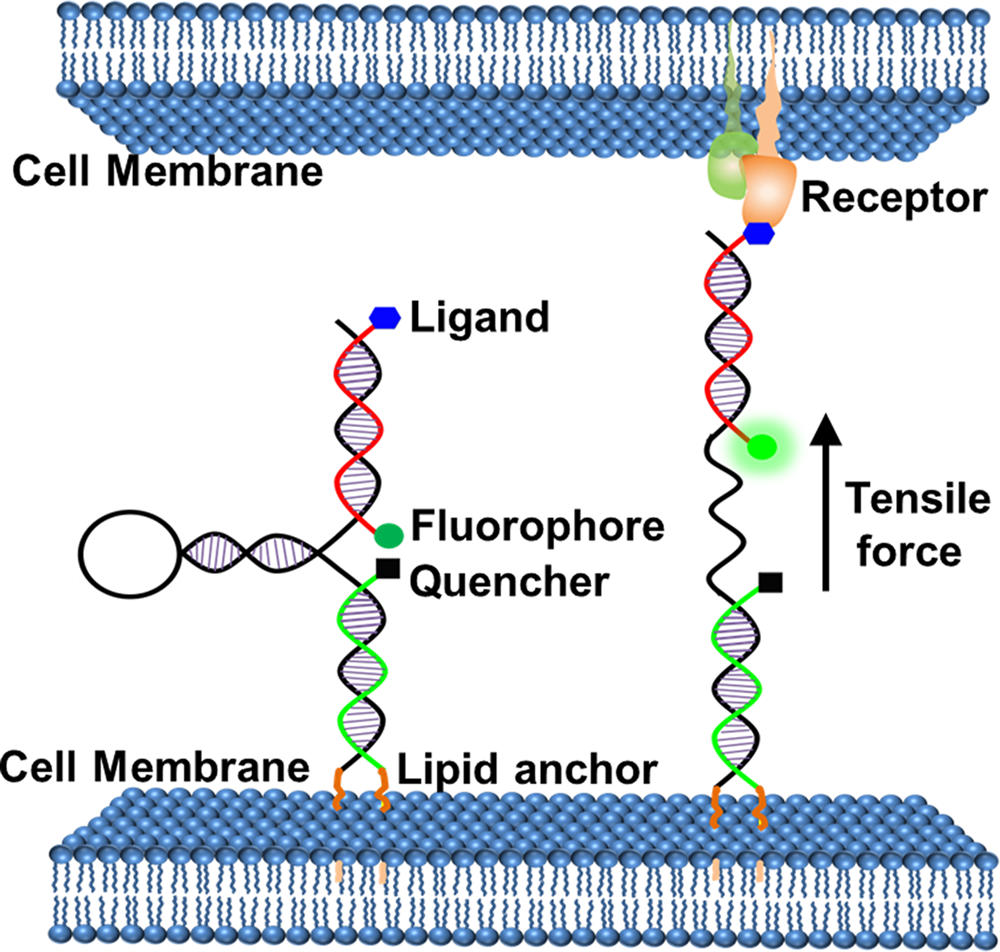
Figure 1 shows Schematic illustration of membrane DNA tension probe.
Details
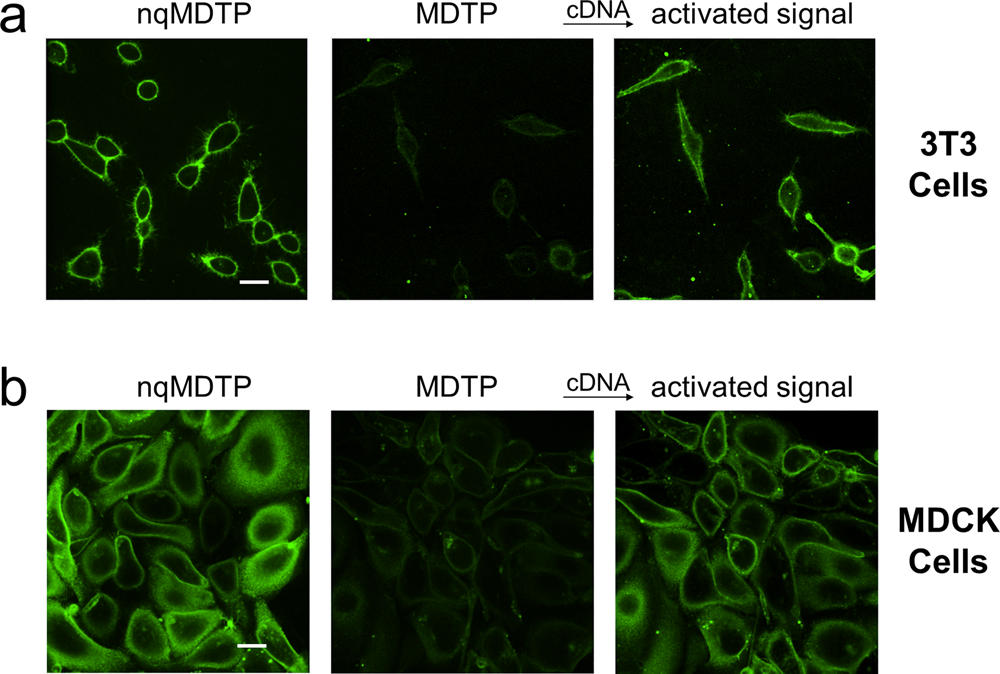
Figure 2 shows the fluorescence image of highly efficient insertion and signal activation of MDTP on 3T3 (a) and MDCK (b) cell membrane. The addition of 5 μM of cDNA was used in this experiment. Scale bar: 20 μm.
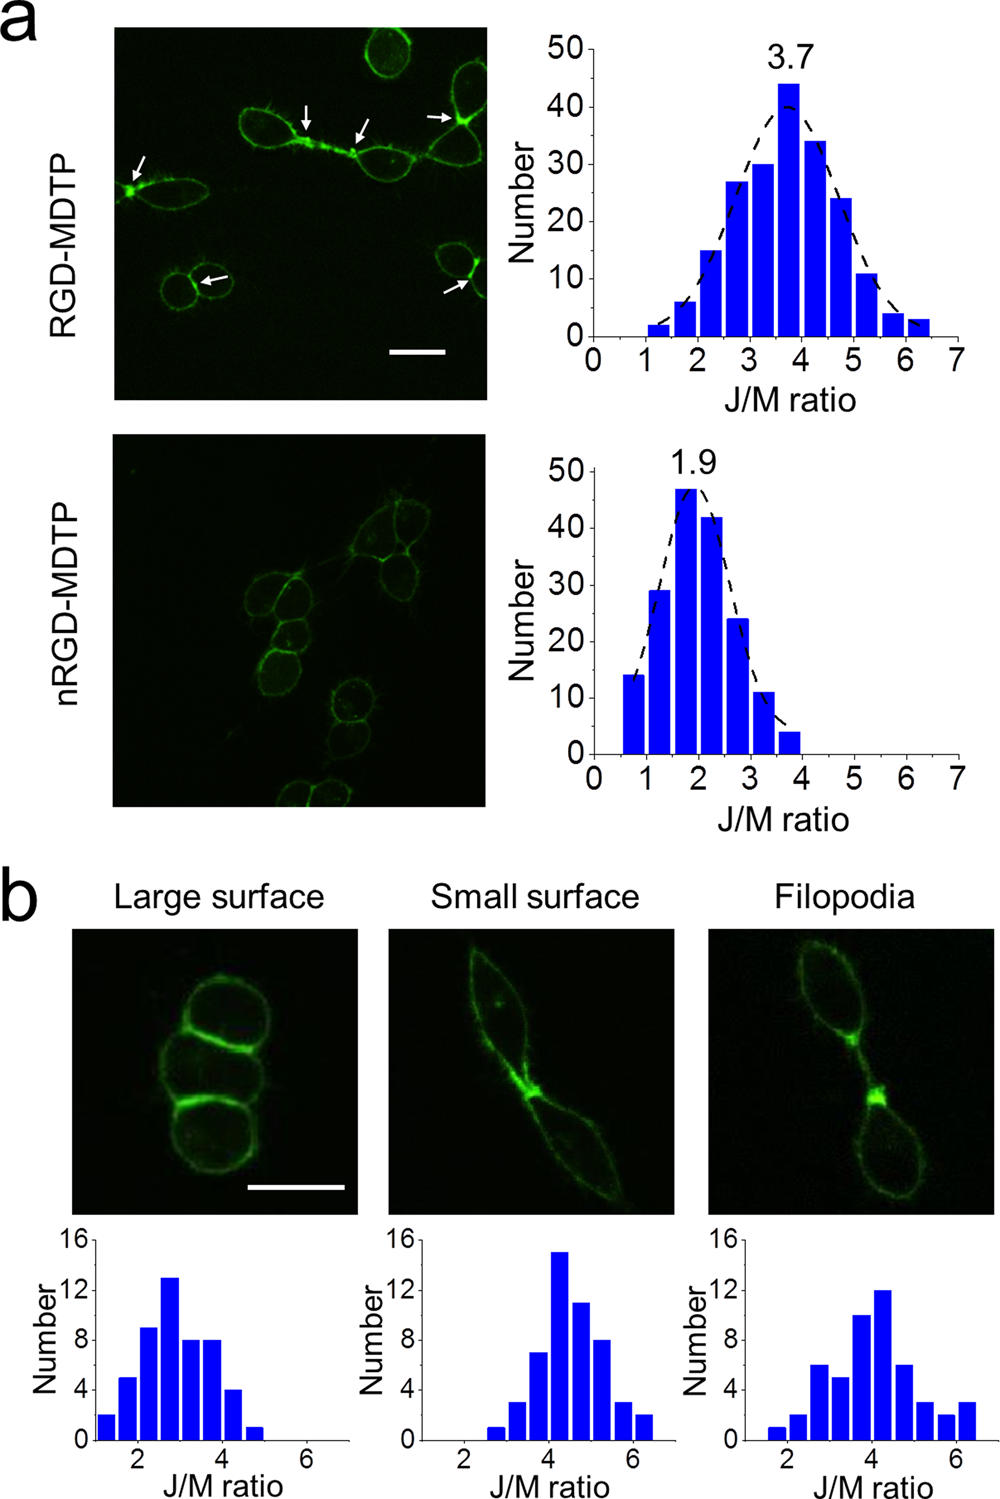
Figure 3 shows the fluorescence image of integrin tension with MDTP. (a) Representative image showing activated fluorescence with RGD-MDTP (top left) and its distribution plot of junction/membrane fluorescence ratio (top right, 200 cell−cell contacts were measured). Results for nRGD-MDTP are shown as a control (bottom). (b) Representative images of different types of integrin-mediated adhesions as visualized with RGD-MDTP and their corresponding distribution plots. Scale bar: 20 μm.
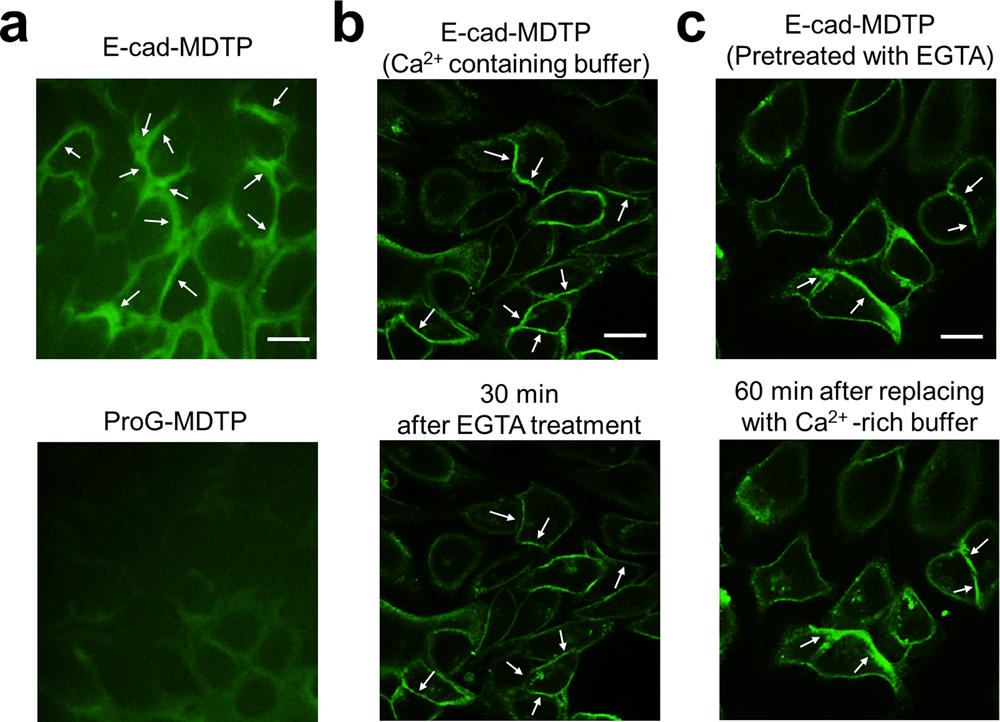
Figure 4 shows the fluorescence image of E-cadherin-mediated tension at cell−cell junctions. (a) Representative images of MDCK cells anchored with E- cad-MDTP and ProG-MDTP. (b) Disruption of E-cadherin-induced tension by post-treating E-cad-MDTP-inserted cells with 10 mM EGTA. (c) Reconstitution of E-cadherin-mediated tension by addition of excess Ca2+. Scale bar: 20 μm.
Reference
[1]”Measuring cell-generated forces: a guide to the available tools”
Polacheck, W. J.; Chen, C. S. Nat. Methods 2016, 13, 415−423.
DOI: 10.1038/nMeth.3834
[2]”E-cadherin is under constitutive actomyosin-generated tension that is increased at cell–cell contacts upon externally applied stretch”
Borghi, N.; Sorokina, M.; Shcherbakova, O. G.; Weis, W. I.; Pruitt, B. L.; Nelson, W. J.; Dunn, A. R. Proc. Natl. Acad. Sci. U. S. A. 2012, 109, 12568−12573.